Technology Insights.
- Great Observability Tools but poor actionable insights?
- Don’t know what s running and where?
- Hard to keep up the pace of technology changes, yet you are on the line when technologies don’t work well.
- Technologies running great but Business doesn’t agree?
- Not sure how to reproduce a user issue or validate a fix?
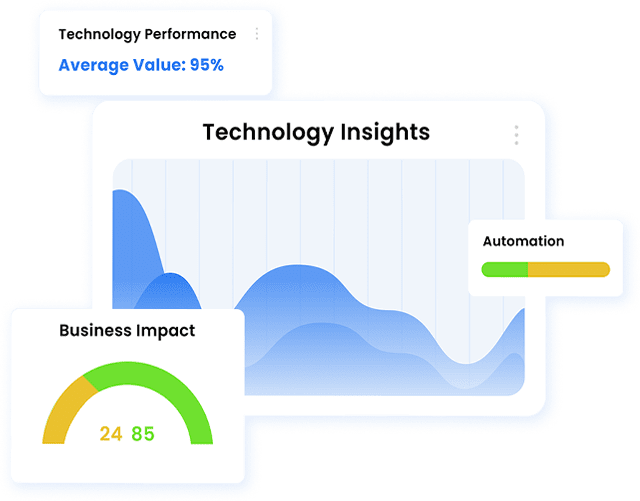
Powerful Features & Capabilities for Precise Technology Insights.
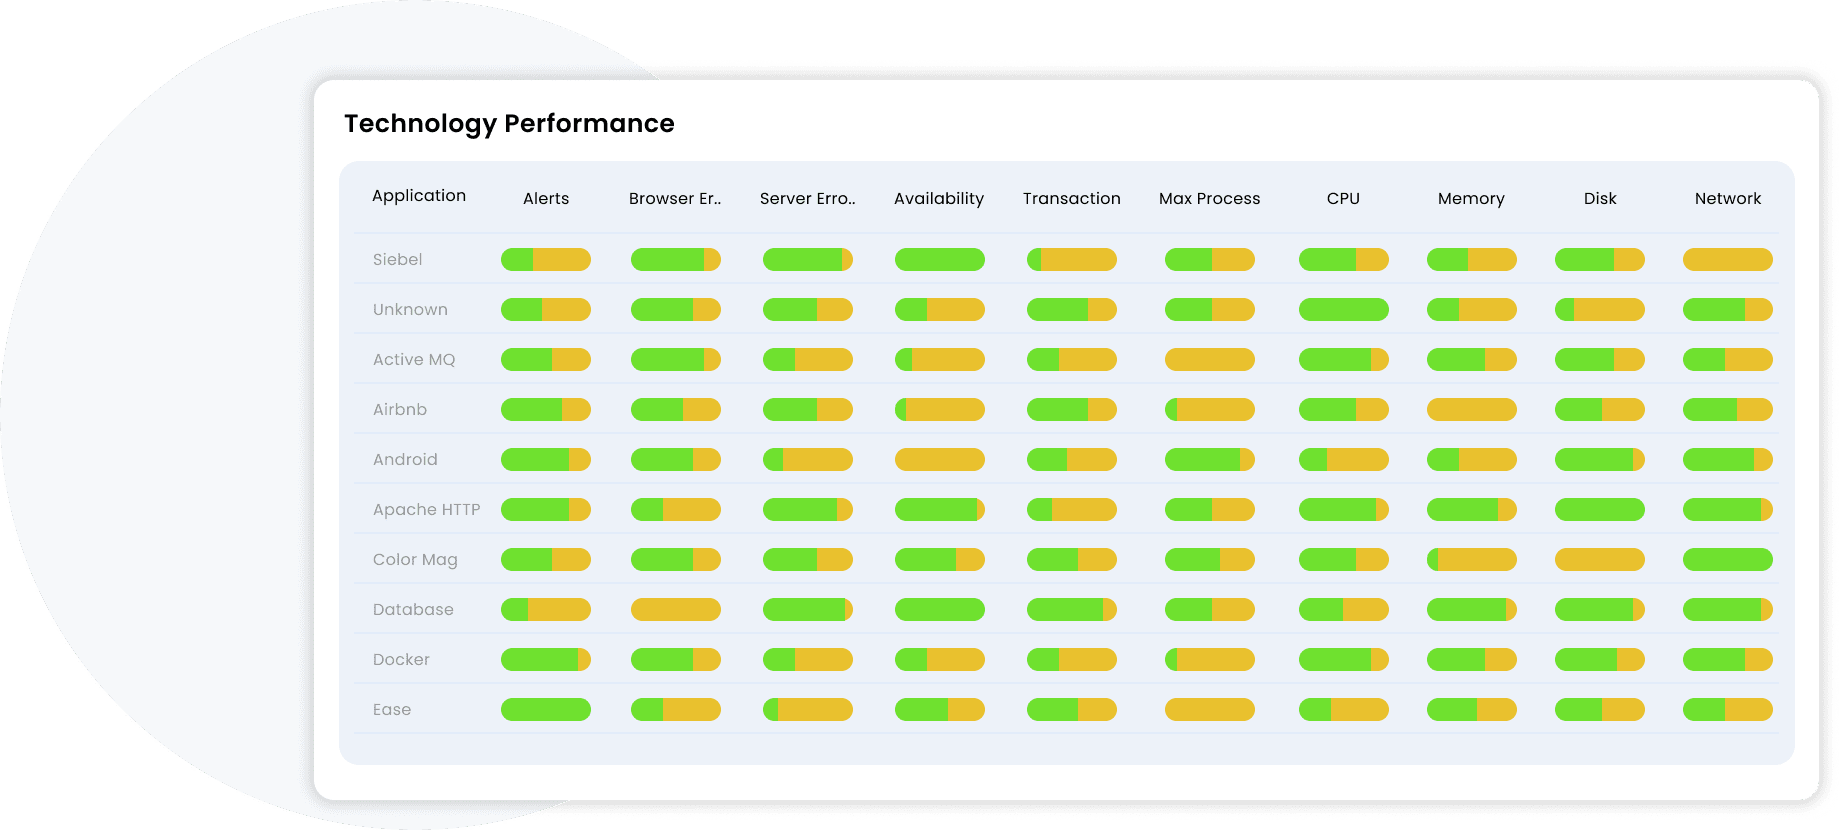
360 degree view of your technology health.
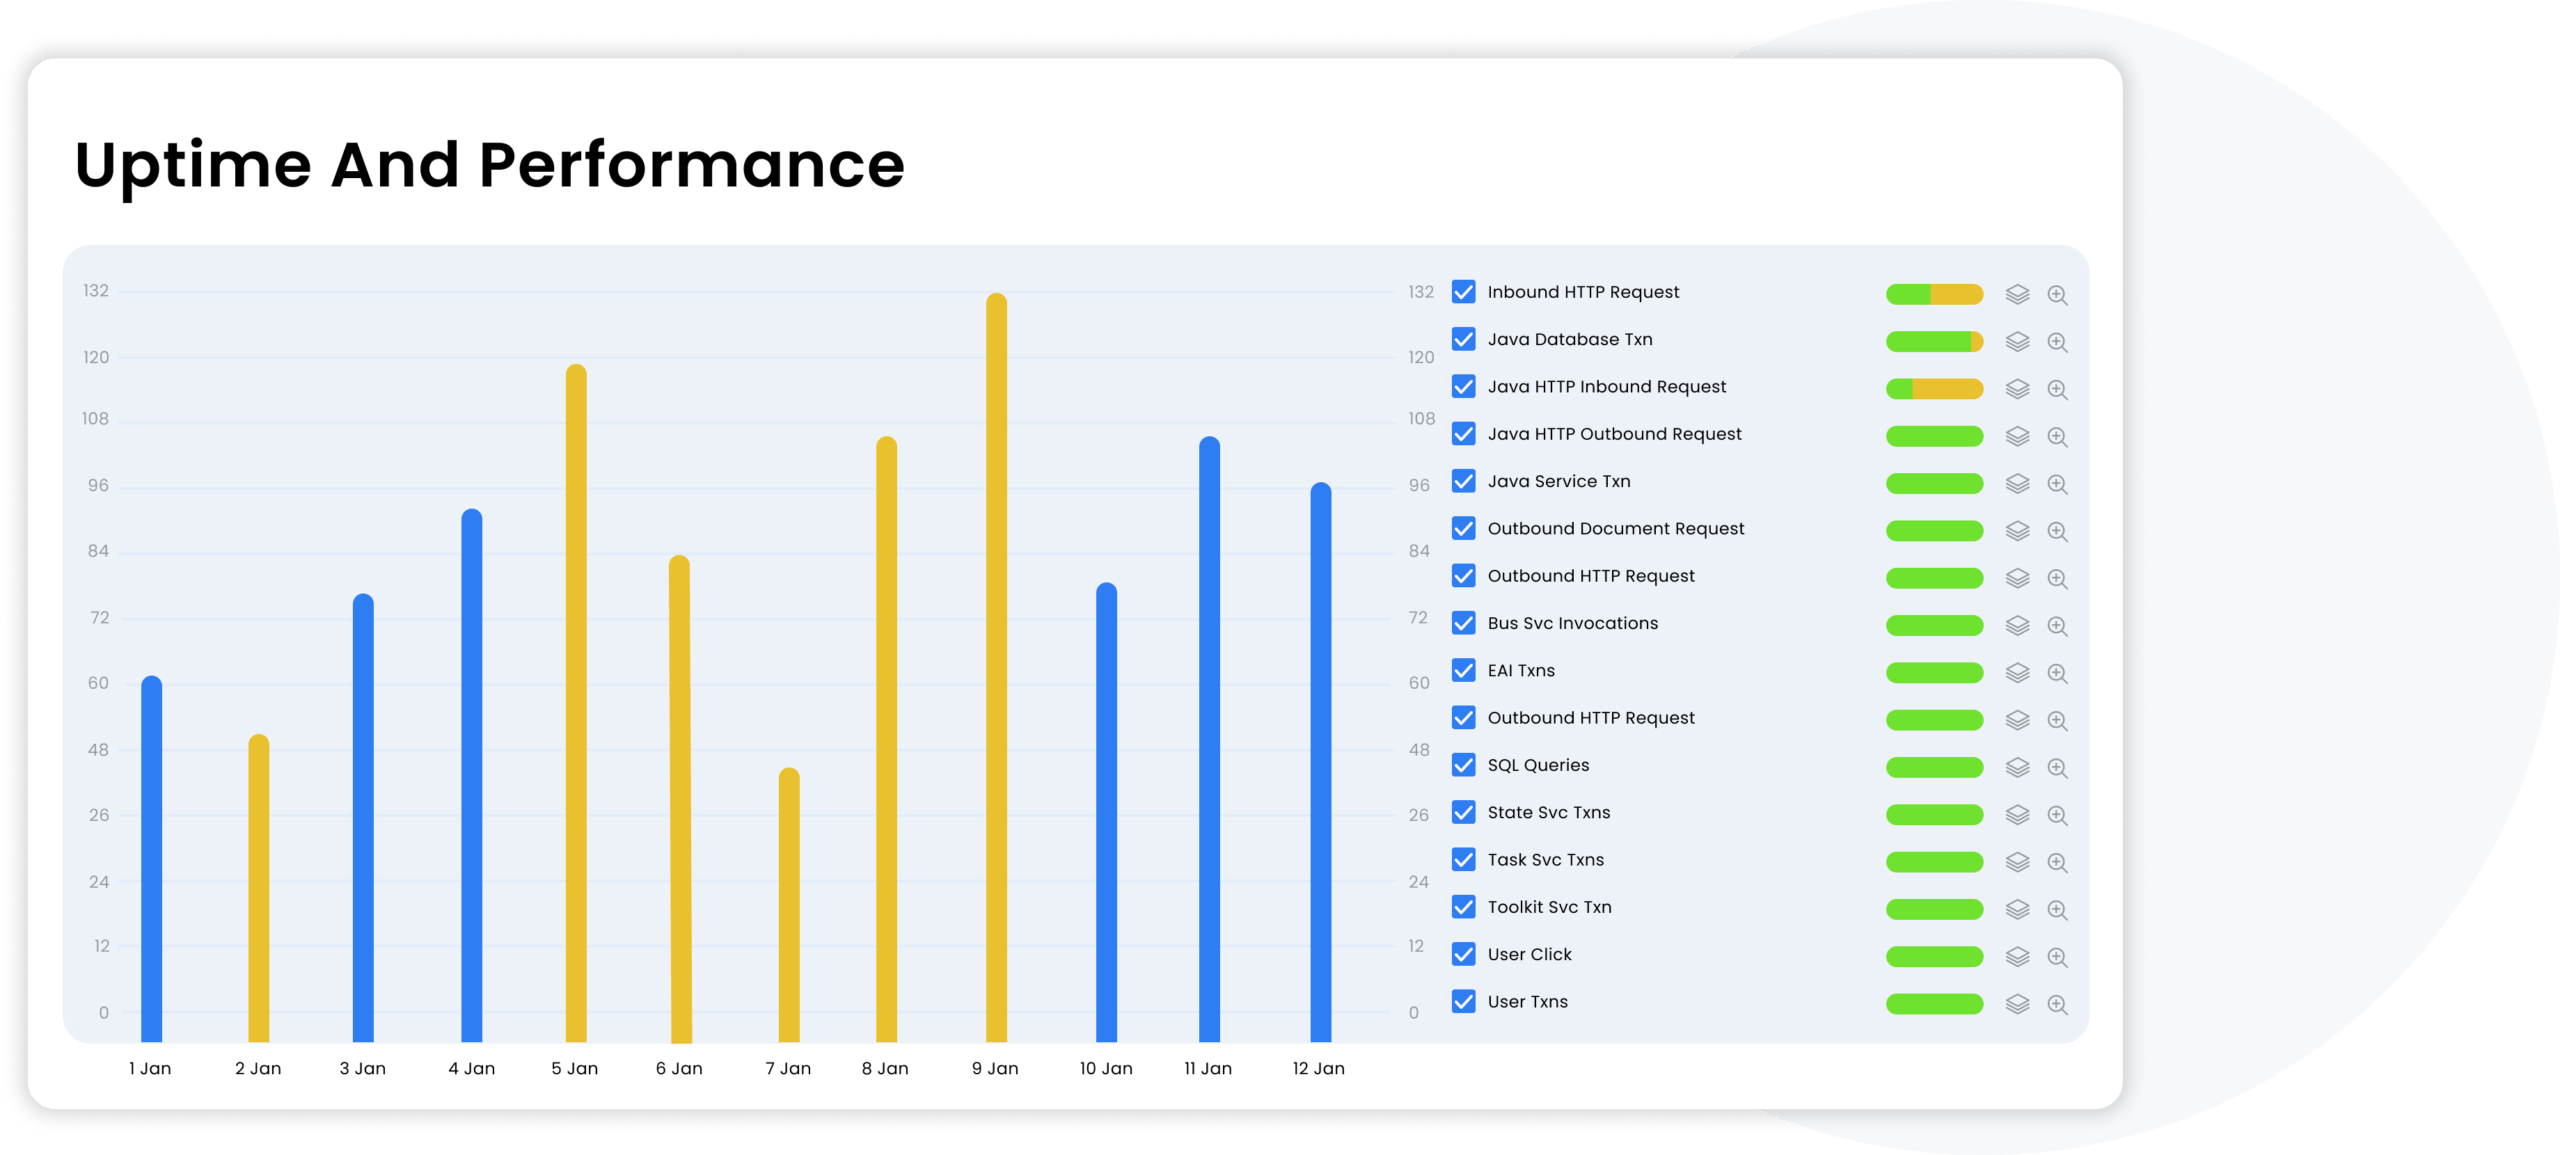
Uptime and performance.
Learn more about Germain’s Operational Dashboard for a 360 degree view of Technology Availability and Performance.
End-to-end metrics.
- Browser freezes.
- CPU cycles.
- Exceptions.
- Ineffective business transactions.
- Integration issues.
- Java container metrics.
- JVM run-time metrics.
- Poor memory allocations.
- NET run-time metrics.
- Network contentions.
- Slow applications.
- Query latencies.
Example of preconfigured KPIs.
Code Analysis.
Quickly, effectively, and proactively identify and resolve poorly performing parts of an application, down to the line of code, front and back-end, in real-time, 24×7.
Learn more about Germain’s Javascript basic and advanced profilers and Germain’s back-end code profilers.
Deep Root-cause Analysis.
Learn about Germain’s transaction tracing, application issue analysis, error analysis, etc.
The Germain Advantage for Optimal UX.

Scale along with your IT growth.

100% searchable.
Learn about our filters and search features.

Very customizable.
How many times does your organization hit a roadblock with a tool and search for another tool? At Germain, we believe that all real-time Alerts, Insights and Automation should be delivered by a single platform and that starts by having a platform that is very customizable, from what data it collects, where, how it analyzes, what automation it applies to it, how it visualizes it, alert on it, and report it, etc
Learn how to extend Germain’s data model, how to create your own monitoring, analytics, automation, dashboard or report.

Exceptional Support.

